February 18, 2025
Model Drift vs. Concept Drift: Detection & Mitigation Strategies for 2026
Contents
Key Takeaways
- Model drift is the umbrella term for AI performance degradation over time; concept drift and data drift are its two most common causes.
- Drift is the norm, not the exception: a peer-reviewed Nature study found temporal degradation in 91% of models tested.
- Three warning signs to watch: accuracy decay without a data change, input data diverging from training data, and predictions skewing toward one outcome.
- LLMs and generative pipelines drift differently: through prompts, knowledge staleness, upstream model updates, and retrieval corpora.
- Manage drift as a continuous cycle: Detect > Diagnose > Retrain; not a one-off fix. Under the EU AI Act, continuous monitoring of high-risk AI systems is becoming a compliance obligation.
AI models are designed to identify patterns, make predictions, and optimize business decisions. However, their performance is not static. Over time, as data distributions shift and real-world conditions evolve, these models can become less accurate. This phenomenon, known as model drift, poses a significant risk to organizations that depend on AI for critical operations.
This isn’t an edge case; it’s the norm. A peer-reviewed study published in Nature’s Scientific Reports tested 128 model–dataset combinations across healthcare, finance, transportation, and weather, and found temporal degradation in 91% of them – a phenomenon the researchers call AI aging. And in 2026, the stakes are no longer just operational: under the EU AI Act, continuous post-market monitoring of high-risk AI systems is becoming a compliance obligation, not a best practice.
Recognizing model drift is essential for maintaining the reliability of machine learning systems. Changes in consumer behavior, market trends, and external factors can gradually erode a model’s predictive power, often without immediate warning. Without proactive monitoring and mitigation, businesses may find themselves making decisions based on outdated or misleading insights.
Understanding how and why model drift occurs is the first step in ensuring long-term AI effectiveness. In this first installment, we’ll unpack the fundamentals: what model drift is, its different types (concept drift, data drift, and more), and why early detection matters. We’ll also explore practical strategies for identifying drift before it impacts your bottom line. We’ll then introduce the Lumenova AI Drift Observability Loop: a three-phase methodology (Detect > Diagnose > Retrain) for catching drift before it impacts your bottom line. In Part II, we’ll dive deeper into advanced prevention tactics, real-world case studies, and future-ready solutions to keep your AI investments resilient.
| 3 Core Warning Signs Your Model is Drifting
1. Accuracy decays without a data change. Performance metrics (precision, recall, F1) decline while input distributions look stable — a likely sign of concept drift. 2. Your data stops looking like your training data. Statistical tests flag distribution shifts in input features, often before accuracy visibly drops — a likely sign of data drift. 3. Predictions skew toward one outcome. The mix of predicted classes shifts away from historical proportions — a likely sign of label drift. |
Understanding ML Model Drift
To begin, let us define what model drift is in practical terms. Simply put, ML model drift refers to the phenomenon where a machine learning model’s predictive power diminishes over time due to changes in the underlying data distribution or environment. Model drift in machine learning is a mismatch between a static model and a changing world.
For instance, consider a credit card fraud detection system trained on historical transaction data. Over time, as criminals develop new tactics and consumer habits evolve, the original patterns the model learned may become obsolete, resulting in decreased detection accuracy. From our experience, recognizing the signs of model drift early is key to maintaining robust and reliable systems.
Anyone researching AI reliability quickly runs into three closely related terms: model drift, concept drift, and data drift. In everyday usage they’re treated as synonyms (vendor documentation, blog posts, and even research papers swap them freely), but the distinction matters more than it seems. Each term points to a different failure mode, each is detected by different signals, and each calls for a different remedy. Confusing them can send a team down the wrong remediation path, retraining a model when the real problem lies elsewhere.
Here’s how the three differ:
Model drift, also called AI model drift or simply AI drift, is the umbrella term: a machine learning model’s predictive performance degrades over time, regardless of the underlying cause. The model stays the same — the world it operates in doesn’t.
Concept drift is a cause of model drift: the relationship between input features (x) and the target variable (y) changes. The inputs may look identical, but what they mean has shifted, accuracy falls even though data distributions appear stable.
Data drift is a distinct cause of model drift: the distribution of the input features (x) changes, while the input–target relationship remains intact. The data looks different before accuracy visibly suffers, often making it the earliest measurable warning sign.
In short: model drift is the symptom; concept drift and data drift are two of its most common diagnoses.
| Term | What drifts | What holds steady | Typical signal |
| Model drift | Predictive performance in production | The model itself | Sustained decline in accuracy, precision, or recall |
| Concept drift | The input–target relationship, P(y|x) | Input distributions may look stable | Accuracy drops with no visible shift in the data |
| Data drift | The input feature distributions, P(x) | The input–target relationship | Distribution shifts in features, often before accuracy falls |
Types of AI Drift
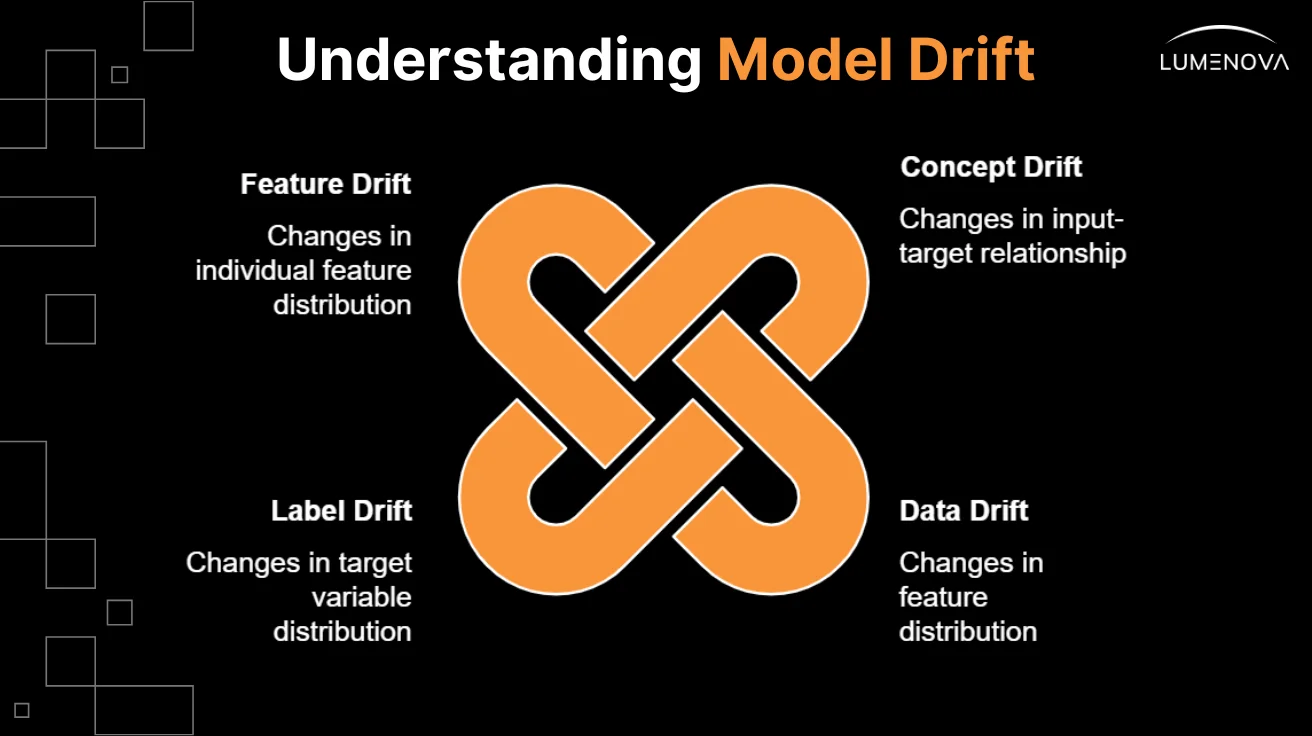
Understanding the nuances of model drift is crucial for maintaining model accuracy and reliability. Below, we outline the four primary types of drift in machine learning:
1. Concept Drift
Concept drift occurs when the relationship between the input features (x) and the target variable (y) changes over time. This type of drift directly impacts the predictive model’s performance because the underlying patterns it has learned no longer hold true.
- Sudden Drift: The relationship changes abruptly.Example: A sudden change in customer behavior due to a new competitor entering the market. In banking, this could mean an unexpected rise in loan defaults following a recession.
- Gradual Drift: The relationship changes slowly over time.Example: Slowly evolving user preferences on a social media platform. In healthcare, this could involve shifting treatment protocols for chronic diseases.
- Incremental Drift: The relationship changes in small, incremental steps.Example: Gradual changes in sensor readings due to wear and tear on machinery. In consumer goods, this could manifest as gradual shifts in consumer preferences toward eco-friendly products.
- Recurring or Seasonal Drift: The relationship changes cyclically, often in a predictable manner.Example: Seasonal changes in product demand (e.g., holiday sales spikes). In retail, predicting inventory levels becomes challenging during peak shopping seasons.
For instance, consider a retail company using an ML model to predict inventory levels. If consumer preferences shift due to seasonal trends or unexpected events (e.g., a global pandemic), the model may struggle to adapt unless updated regularly.
2. Data Drift (Covariate Shift)
Data drift, also known as covariate shift, occurs when the distribution of the input features (x) changes over time, while the relationship between the features and the target variable remains the same. Even though the underlying relationship hasn’t changed, this shift can still degrade model performance if the model was trained on a different feature distribution.
Example: Changes in user demographics on an e-commerce site, such as a significant increase in younger users over time. In finance, this could mean a growing proportion of millennial investors whose spending habits differ from older generations.
3. Label Drift (Prior Probability Shift)
Label drift happens when the distribution of the target variable (y) changes over time, without a change in the relationship between input features and the target variable. This type of drift is particularly relevant in classification problems where class proportions fluctuate.
Example: A change in the proportion of spam to non-spam emails over time. In healthcare, this could involve changing prevalence rates of certain diseases due to improved diagnostic tools or public health interventions.
4. Feature Drift
Feature drift refers to changes in the distribution of individual features. While similar to data drift, feature drift focuses specifically on the behavior of certain features rather than the overall input distribution.
Example: A sudden increase in a particular product’s sales due to a viral marketing campaign, affecting the sales feature. In banking, this could occur if there’s a surge in credit card applications after a promotional offer.
How Drift Differs in LLMs and Generative Pipelines
The taxonomy above was developed for traditional tabular ML, where drift is measurable against a clear ground truth: features have fixed schemas, labels arrive eventually, and accuracy can be computed directly. Generative systems break these assumptions. An LLM’s inputs are open-ended text, its outputs have no single correct answer, and “performance” is multidimensional — factuality, relevance, tone, safety. Drift still happens; it just wears different clothes:
- Prompt drift: the distribution of user inputs shifts — new topics, jargon, languages, or adversarial patterns the system wasn’t evaluated on. This is data drift, but it must be detected in embedding space rather than through per-feature statistical tests.
- Knowledge drift: the model is frozen while the world moves. Facts learned during training go stale, so answer quality decays even though nothing about the input distribution or the model has changed — a form of concept drift unique to knowledge-bearing models.
- Upstream model drift: pipelines built on third-party model APIs inherit silent behavioral changes whenever the provider updates the underlying model. Here it is the model itself that drifts under your application — the inverse of the classic setup.
- Retrieval drift: in RAG architectures, the knowledge base, embeddings, and index each drift independently. A stale corpus or an embedding model swap can degrade output quality while the LLM itself remains untouched.
- Behavioral drift: output characteristics — hallucination rate, refusal rate, verbosity, tone — shift over time as a compound effect of the above, often surfacing first in user feedback rather than in any metric.
The differences run through every phase of the drift lifecycle:
| Dimension | Traditional ML | Generative / LLM pipelines |
| What drifts | Feature and label distributions | Prompts, knowledge, upstream models, retrieval corpora, output behavior |
| Ground truth | Labels arrive eventually; accuracy is directly computable | No single correct output; quality is multidimensional (factuality, relevance, tone, safety) |
| Detection methods | Statistical tests on features (Kolmogorov-Smirnov, Chi-square), performance dashboards | Embedding-distribution comparison, semantic similarity vs. golden datasets, LLM-as-judge evaluations |
| First symptom | Metric decline on monitoring dashboards | Often user feedback: hallucinations, off-tone responses, rising refusal rates |
| “Retraining” means | Retraining the model on fresh data | Updating retrieval corpora, prompts, or fine-tunes — full retraining is the last resort |
Different signals, same discipline: with the right AI observability layer in place, the Loop — Detect > Diagnose > Retrain — applies to generative systems just as it does to tabular ML.
Causes of AI Drift
Model drift doesn’t occur in isolation, but it arises from a combination of internal and external factors. Below are some common causes of drift across industries:
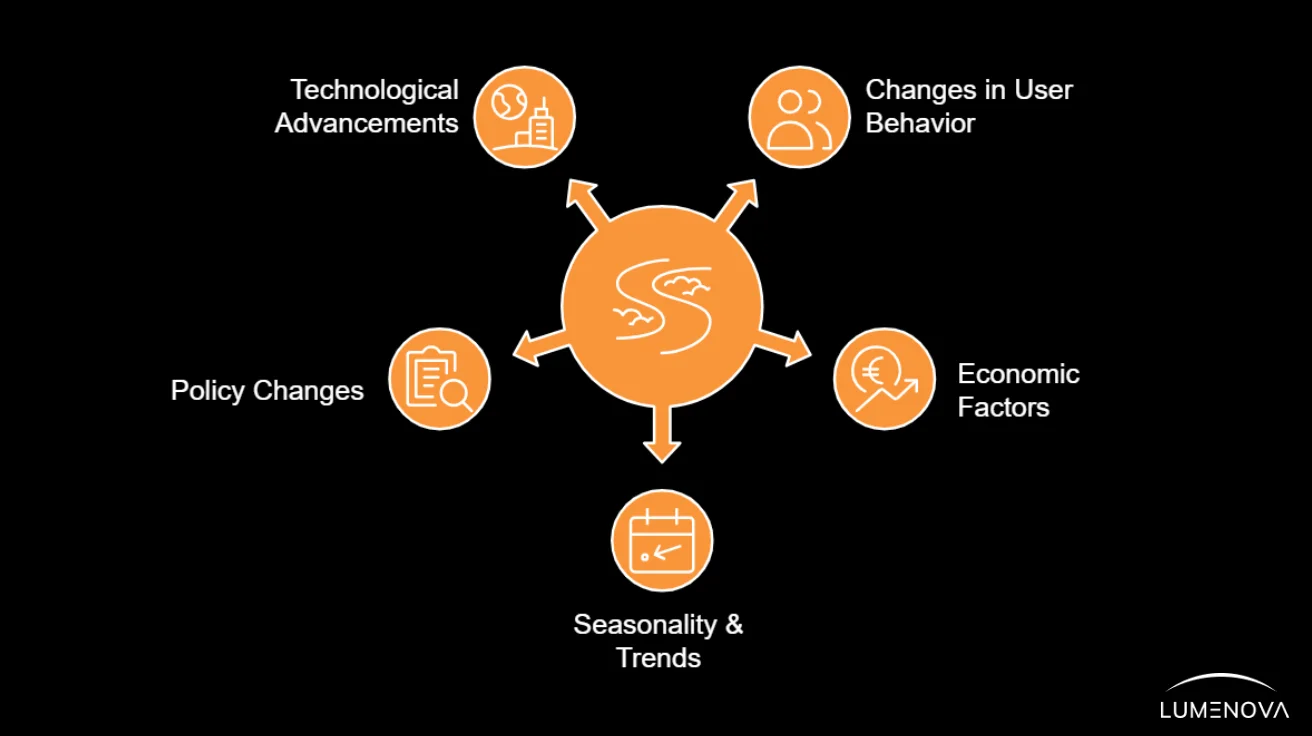
Changes in User Behavior
Consumer preferences, technological advancements, and cultural shifts all influence user interactions with products or services, leading to altered datasets.
Example: A streaming service observing increased binge-watching habits during lockdowns.
Economic Factors
Economic cycles, inflation rates, unemployment levels, and regulatory changes can significantly impact business operations and, consequently, predictive models.
Example: A financial institution noticing higher default rates during an economic downturn.
Seasonality & Trends
Seasonal variations or emerging trends can introduce temporary fluctuations that skew long-term predictions unless accounted for properly.
Example: Retailers facing spikes in demand during holiday seasons.
Policy Changes
Regulatory updates or organizational policy modifications might necessitate changes in operational procedures reflected in collected data streams.
Example: Healthcare providers adapting to new compliance requirements after legislative changes.
Technological Advancements
Innovations in technology can render existing models obsolete, requiring updates to keep pace with modern standards.
Example: An autonomous vehicle manufacturer updating its object detection algorithms to incorporate LiDAR data.
When Drift Goes Unmonitored: An Illustrative Scenario
Consider a scenario that plays out in some form across many industries. A mid-sized payments company runs a fraud detection model in production. It was trained on two years of transaction data, performed well at launch, and — critically — was never placed under continuous monitoring. Approval rates and fraud losses were reviewed monthly, in aggregate.
Then the environment changes abruptly: a large data breach at an unrelated retailer floods the market with stolen card credentials, and fraudsters shift tactics — smaller test transactions, new merchant categories, different times of day. The relationship between transaction features and the “fraud” label has changed overnight: classic sudden concept drift.
The model, still scoring transactions against yesterday’s patterns, confidently approves what it was never trained to recognize. Because nothing about the pipeline is technically broken — no errors, no downtime — no alarms sound. The degradation only surfaces six weeks later, when the monthly chargeback report shows fraud losses several times above baseline. By then, the damage includes direct losses, a spike in manual review workload, and difficult conversations with card networks.
The uncomfortable part: all three warning signs above were present within days of the shift. Precision had dropped sharply against stable input volumes, the distribution of transaction features had visibly moved, and the predicted fraud rate had fallen below its historical floor. The signals existed — no one was watching them. This is precisely the gap that a structured monitoring cycle is designed to close. Concept drift detection in financial machine learning is the difference between a contained incident and a quarterly loss.
How to Detect and Fix Concept Drift in Production: The Lumenova AI Drift Observability Loop
Managing drift isn’t a one-off fix, it’s a continuous cycle. At Lumenova AI, we frame drift management as a three-phase loop: Detect performance and distribution anomalies early. Diagnose the type and root cause of drift, and Retrain models on schedule or on trigger. Each phase feeds the next, turning drift from an unpredictable failure mode into a governed, repeatable process.
Phase 1: Detect
Detecting model drift early can mean the difference between a minor adjustment and a costly system overhaul. AI models often degrade gradually, and if the decline is not addressed in time, businesses can face serious financial and operational consequences. As data distributions drift, AI systems can lose accuracy without any visible failure.
Take an e-commerce recommendation engine as an example. If consumer preferences shift due to emerging trends, an undetected AI drift could lead to irrelevant product suggestions. This not only reduces customer engagement but also impacts revenue. Similarly, in financial services, a credit risk model that does not adjust to economic shifts may approve high-risk loans or deny creditworthy applicants, increasing both financial exposure and customer dissatisfaction: a scenario that well-configured AI risk management is designed to prevent.
Early detection enables proactive intervention, allowing data teams to recalibrate models before they cause major disruptions. By continuously monitoring performance metrics and distribution changes, organizations can prevent drift from eroding business value.
As mentioned earlier, detecting model drift early is essential for maintaining system reliability. Several tools and techniques can help identify potential issues before they escalate:
1. Statistical Tests
Utilizing statistical tests like the Kolmogorov-Smirnov test or Chi-square test allows us to compare distributions across periods, highlighting significant deviations indicative of possible drift. Platforms like Lumenova’s AI evaluations run these tests continuously against live production data, so deviations surface as alerts rather than post-mortems.
Example: Comparing the distribution of transaction amounts before and after a major marketing campaign.
2. Monitoring Dashboards
Implementing real-time dashboards provides visual cues regarding key performance metrics such as precision, recall, F1 score, etc., enabling swift intervention upon noticing declines.
Example: A fraud detection system triggering alerts when transaction patterns deviate from expected norms.
Dashboard Features:
- Real-Time Alerts: Notify stakeholders of anomalies as they occur.
- Historical Trends: Visualize performance over time to identify gradual changes.
- Drill-Down Capabilities: Investigate specific areas of concern in greater detail.
3. Automated Alerts
Setting thresholds based on acceptable variance ranges triggers alerts automatically when breaches occur, facilitating timely adjustments.
Example: A manufacturing plant receiving notifications when equipment sensors detect abnormal vibrations.
Best Practices for Automated Alerts:
- Define thresholds dynamically based on historical data.
- Prioritize alerts based on severity and potential impact.
- Integrate alerts with incident management systems for seamless resolution.
4. AI Drift Detection Algorithms
Specialized algorithms designed to monitor and quantify drift can provide actionable insights into when and where drift occurs.
Example: Using ADWIN (Adaptive Windowing) to detect gradual changes in data streams.
Our Responsible AI Platform helps businesses track and manage ML model performance, providing insights that support proactive drift detection and mitigation.
Phase 2: Diagnose
Detection tells you something has changed. Diagnosis tells you what and why. Once an alert fires, the next step is pinpointing which type of drift you’re facing: concept, data, label, or feature, because each demands a different response. Comparing feature distributions, segmenting performance by cohort, and reviewing recent external events (policy changes, market shifts, seasonality) helps isolate the root cause. Misdiagnosing drift is costly: retraining a model on new data won’t help if the real issue is a broken upstream data pipeline. A structured diagnostic process ensures remediation targets the actual problem, not just its symptoms.Treated this way, model drift detection becomes part of the AI incident response lifecycle: detection raises the incident, diagnosis scopes it, and retraining resolves it.
The matrix below maps each drift type to the metrics that reveal it and an example detection rule to operationalize monitoring:
| Drift type | What to measure | Statistical metrics / tests | Example detection rule |
| Concept drift | Model performance against stable inputs | Accuracy, F1, AUC over time; DDM, ADWIN | F1 falls more than 5% below baseline across two consecutive windows while input PSI stays under 0.1 → investigate concept drift |
| Data drift | Input feature distributions | PSI, Kolmogorov-Smirnov test, Jensen-Shannon divergence | PSI above 0.2 on any top-10 feature → alert; above 0.25 → trigger retraining review |
| Label drift | Predicted and actual class proportions | Chi-square test on label distribution; prior probability ratio | Predicted positive rate deviates more than 3σ from its historical mean → alert |
| Feature drift | Behavior of individual features | Per-feature KS/PSI; missing-value rate; cardinality checks | A single feature’s PSI exceeds 0.25, or its null rate doubles → inspect the upstream data pipeline |
Phase 3: Retrain
With the drift type confirmed, remediation typically means retraining, but when and how matter. Organizations generally choose between scheduled retraining (fixed cadence, e.g., monthly) and trigger-based retraining (initiated when drift metrics breach thresholds). Trigger-based approaches are more resource-efficient and responsive, but require the robust detection infrastructure established in Phase 1.
After retraining, validate the new model against both historical and recent data before deployment. Then the loop begins again, with monitoring resuming on the updated model. We’ll cover advanced retraining frameworks in depth in Part II.
Conclusion
Model drift isn’t a question of if but when. When the underlying patterns drift, model predictions quietly detach from reality. By understanding its types (from sudden concept shifts to gradual data decay) and adopting a structured cycle like the Drift Observability Loop, businesses can move from reactive firefighting to proactive governance. Tools like statistical tests, monitoring dashboards, and automated alerts act as early warning systems, buying critical time to recalibrate models.
For leaders, this isn’t just about preserving accuracy, but also about safeguarding ROI. A retail chain catching seasonal demand shifts early avoids stockouts; a bank detecting fraud patterns in real-time prevents losses. In Part II, we’ll explore how to turn these early signals into long-term resilience through advanced retraining frameworks, ethical AI practices, and cutting-edge technologies like edge computing. Stay tuned to future-proof your AI strategy.
For insights into the evolving landscape of AI governance and risk mitigation, visit our blog. If you’re ready to strengthen your AI strategy and implement proactive monitoring, book a demo today to see how Lumenova AI can help.